Geotechnical engineering job postings in the United States during 2025 show clear patterns in required years of experience, reported salary levels, and geographic concentration. The following summary presents observed values from geotechnical job listings recorded during the year.
Years of Experience
Job postings are grouped into four experience categories. Positions requiring 4–7 years of experience represent the largest share of geotechnical job listings, accounting for 40% of postings. Roles requiring 0–3 years of experience follow, comprising 32% of the total.
Table 1: Distribution of required years of experience in job postings in the geotechnical engineering field.
|
Geotech experience (years) |
Job posts |
|
0-3 |
32% |
|
4-7 |
40% |
|
8-14 |
21% |
|
11+ |
7% |
Postings requiring 8–10 years of experience account for 21%, while positions requiring 11 or more years of experience represent 7% of all geotechnical job listings in 2025.
Salary Trends

Figure 1: Annual Salary (in $) in 2025 job postings by year of experience in the geotechnical engineering field.
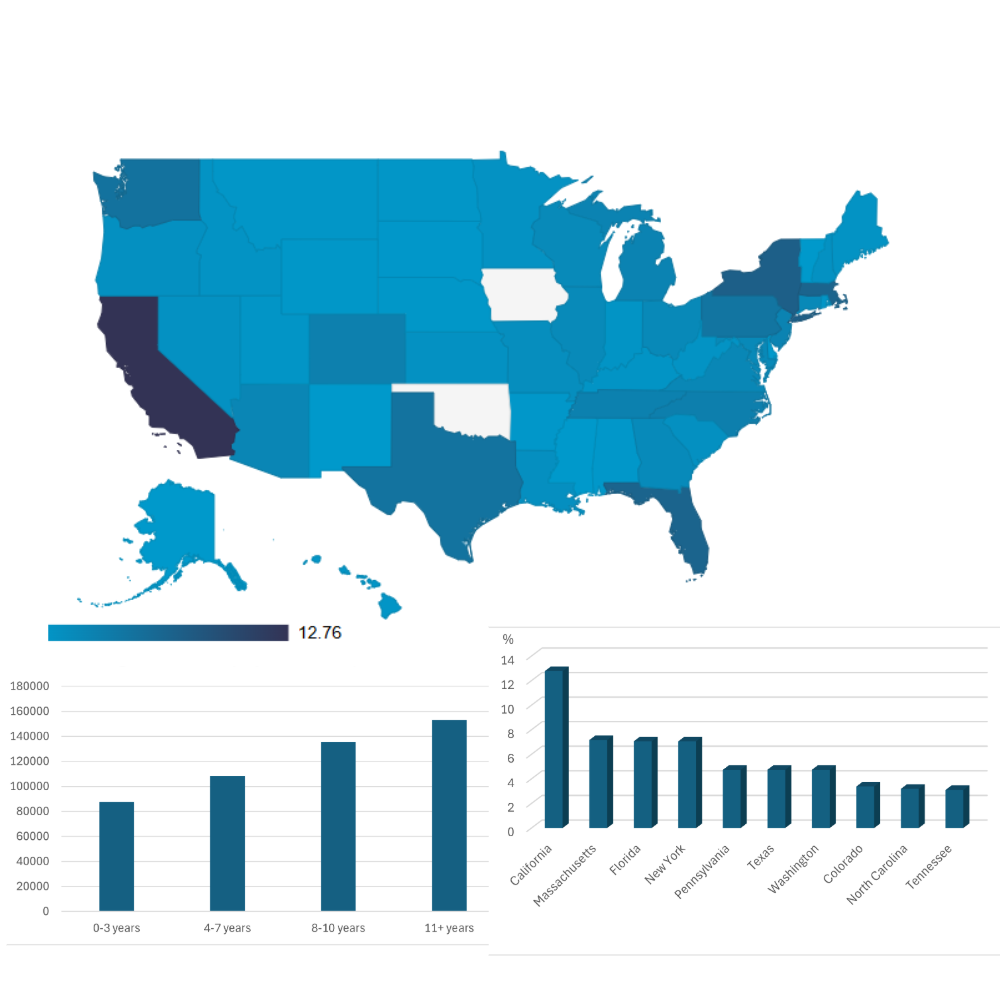
Average annual salary values vary by experience level. For postings requiring 0–3 years of experience, the average annual salary is $87,792. Positions requiring 4–7 years of experience report an average annual salary of $108,384.
Roles requiring 8–10 years of experience have an average annual salary of $135,556, while postings requiring 11 or more years of experience show an average annual salary of $153,333. All salary values are reported in U.S. dollars and reflect averages derived from job postings that include compensation information.
Geographical Distribution
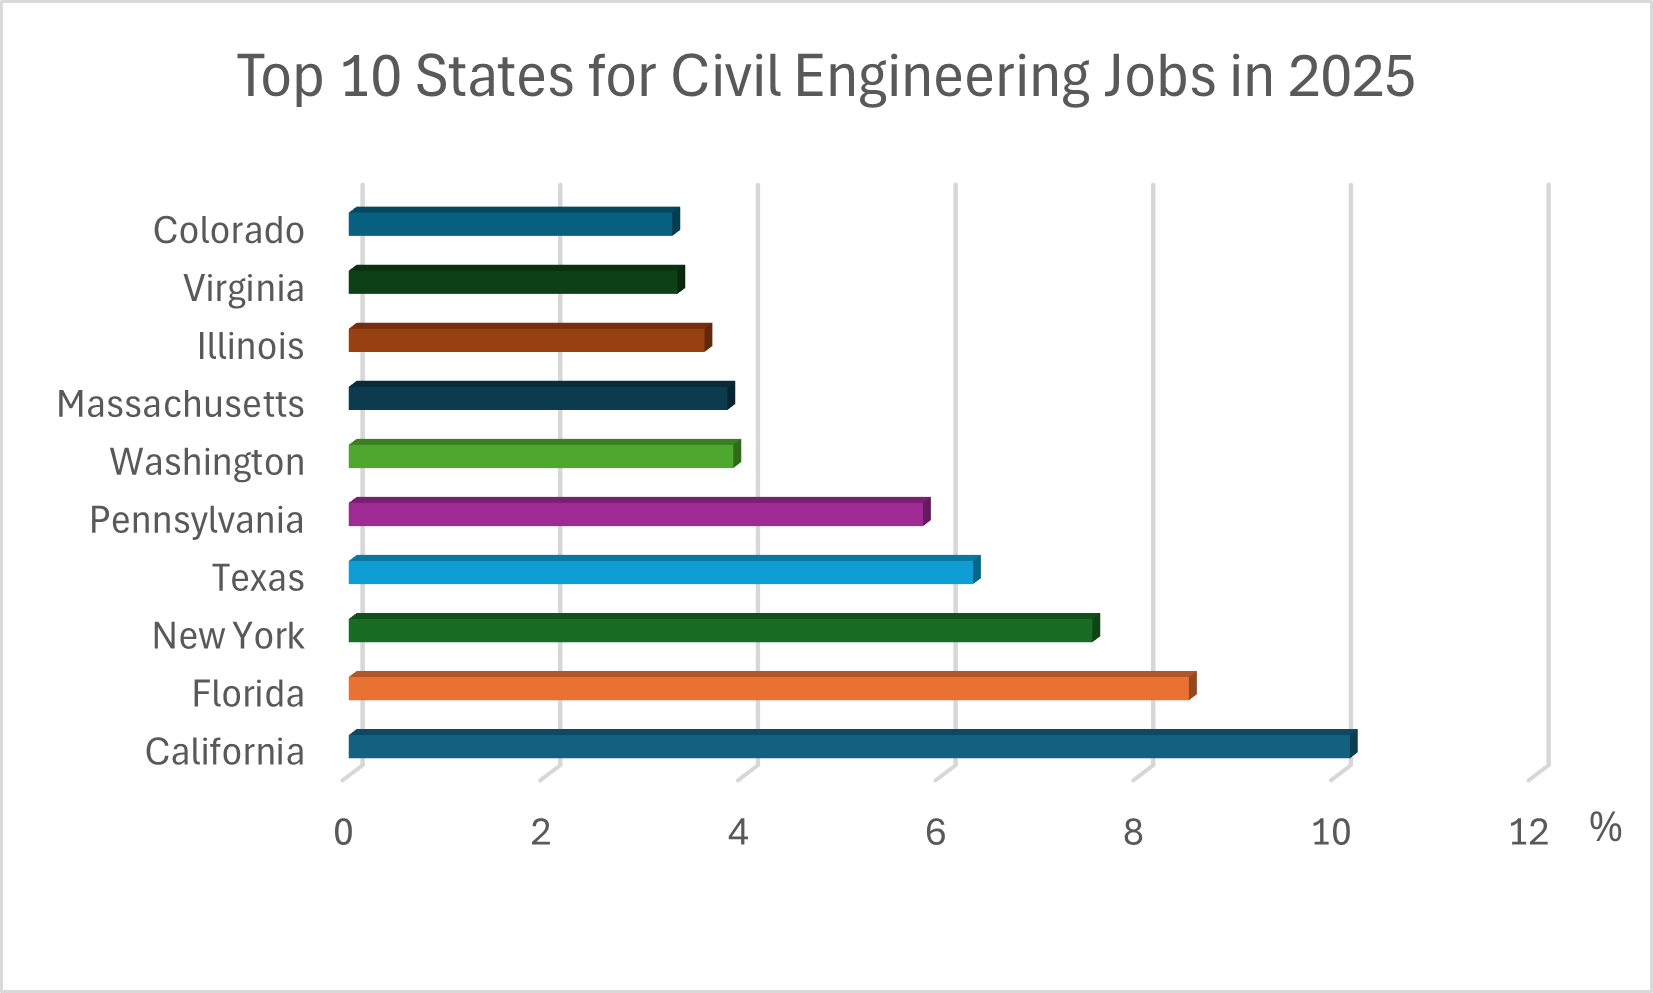
Geotechnical engineering job postings in 2025 are concentrated in a limited number of U.S. states. California accounts for the highest share of postings. Massachusetts, Florida, and New York also represent notable portions of the total. Texas and Washington follow, with additional postings recorded in Pennsylvania, Colorado, North Carolina, and Tennessee.

The accompanying figure illustrates the percentage distribution of geotechnical job postings by state.

Figure 3: State heatmap of percentage of jobs posted.